Automated Demand Forecasting, Inventory Replenishment and Out-of-stock Preventing System
Forecasting Module is analyzing the past datapoints and projects the future datapoints. Basing on this data, the inventory balance for the future periods is predicted, and in case if the predicted inventory balance below the products minimum, shipments and production are proposed in order to avoid product OOS.
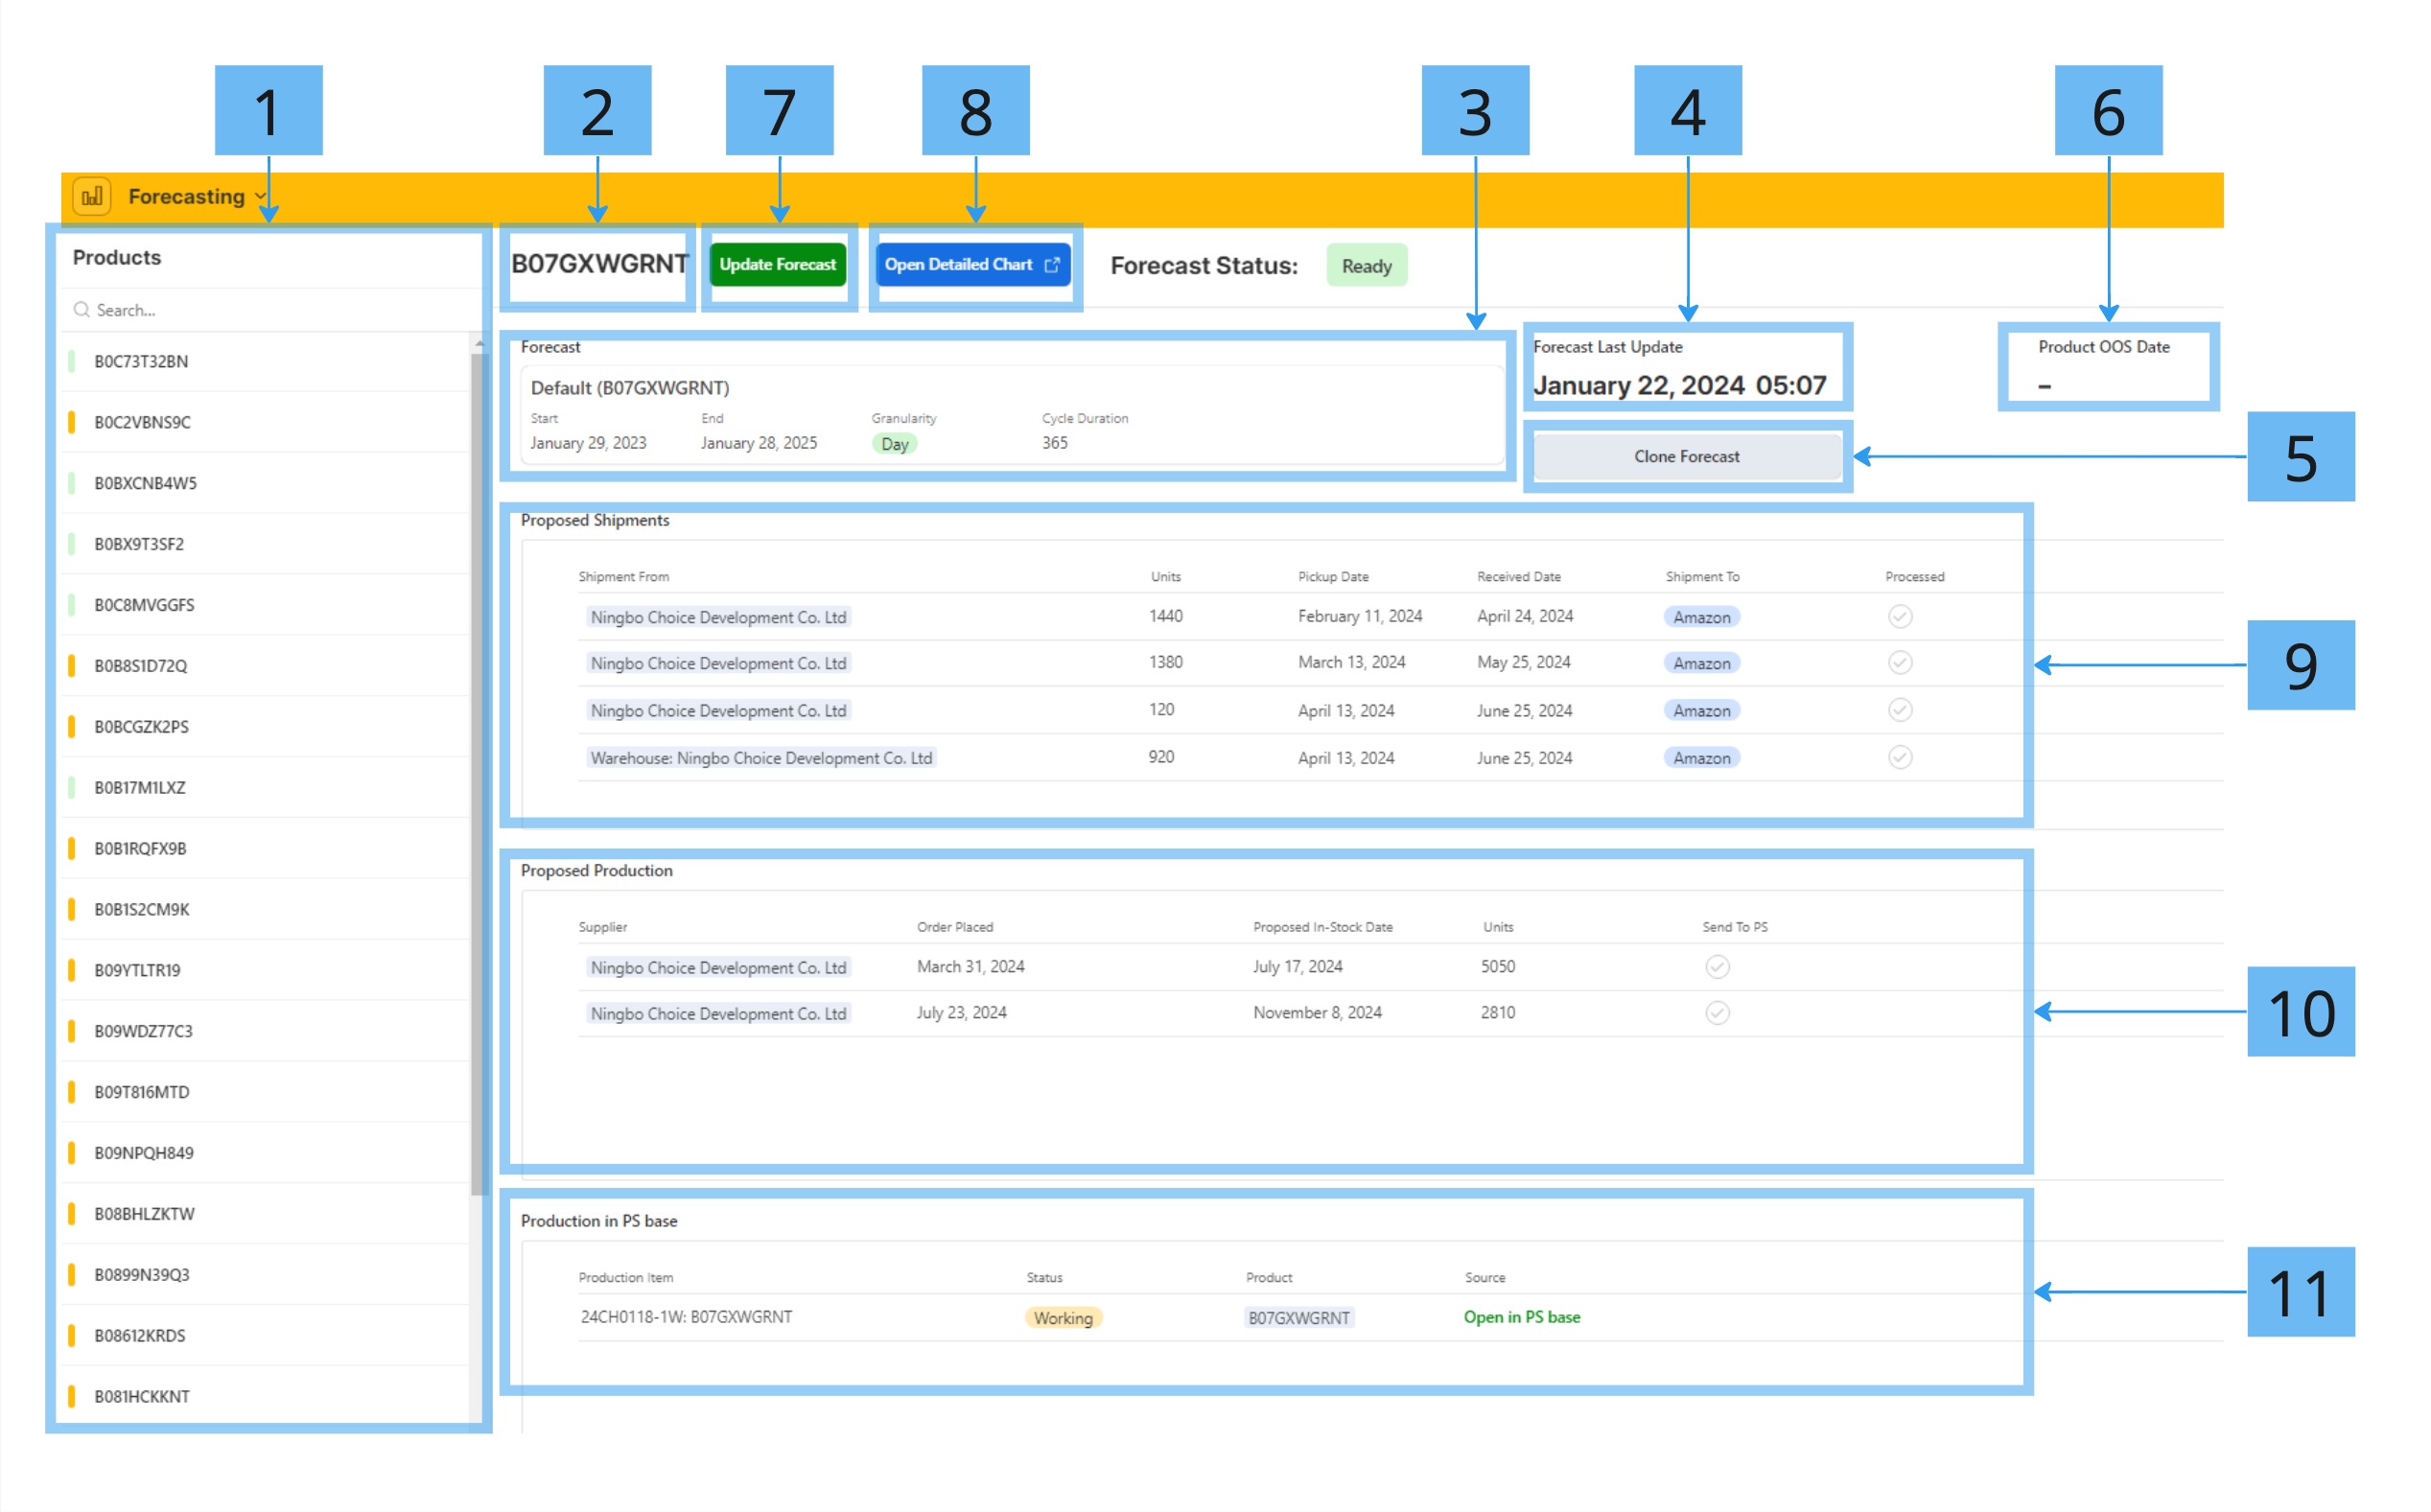
1. Main Interface: Products

- Product List
- the list of active products
- color marks:
- Green (OK) - product's forecast is up-to-date, and there are no proposed items created by the product's forecast
- Orange (Actions required) - product's forecast is up-to-date, but there are proposed items created by the product's forecast
- Grey (Outdated) - forecast preset is not selected for the product or the forecast is outdated
- Product ASIN
- Forecast Preset
- Forecast preset for this product. Click on the box to open the Forecast's settings
- One Forecast preset may be used for multiple products. Use Clone Forecast button before modifying a forecast settings, as the modification might affect other products' forecasts.
- Forecast Last Update
- Timestamp of the last forecast run for the product
- If this date is more than 1 week ago, the forecast is considered outdated
- Clone Forecast
- Creates a full copy of the forecast preset
- This functionally should be used for safe duplicating of a forecast preset and experimenting with it setting
- Product OOS Date
- If an Product OOS situation is predicted for the product, and it can't be fixed with proposed shipments or productions, this field will display the estimated OOS date
- Update Forecast
- Runs the forecast
- Building the forecast can take up to 5 minutes
- Building is performed on the back-end, and the current status is indicated in Forecast Status field. You can continue using interface while a product's forecast is being built.
- When the forecast is ready, Forecast Status will display green Ready status
- Open Detailed Chart
- Opens the detailed chart of the forecast, read more here: Automated Demand Forecasting, Inventory Replenishment and Out-of-stock Preventing System#4. Detailed Forecast Chart
- Proposed Shipments
- List of proposed shipments
- As shipments require manual grouping in PS base, they cannot be automatically created in PS base
- Processed shipments may be filtered out of the list by ticking the Processed checkbox
- Proposed Production
- List of proposed production items
- Send to PS - this checkbox triggers an automation that creates a new Production item with status Proposed in PS/Production table
- Production in PS Base
- List of the uncompleted Production Items in PS base - for reference purposes
2. Forecast Structure

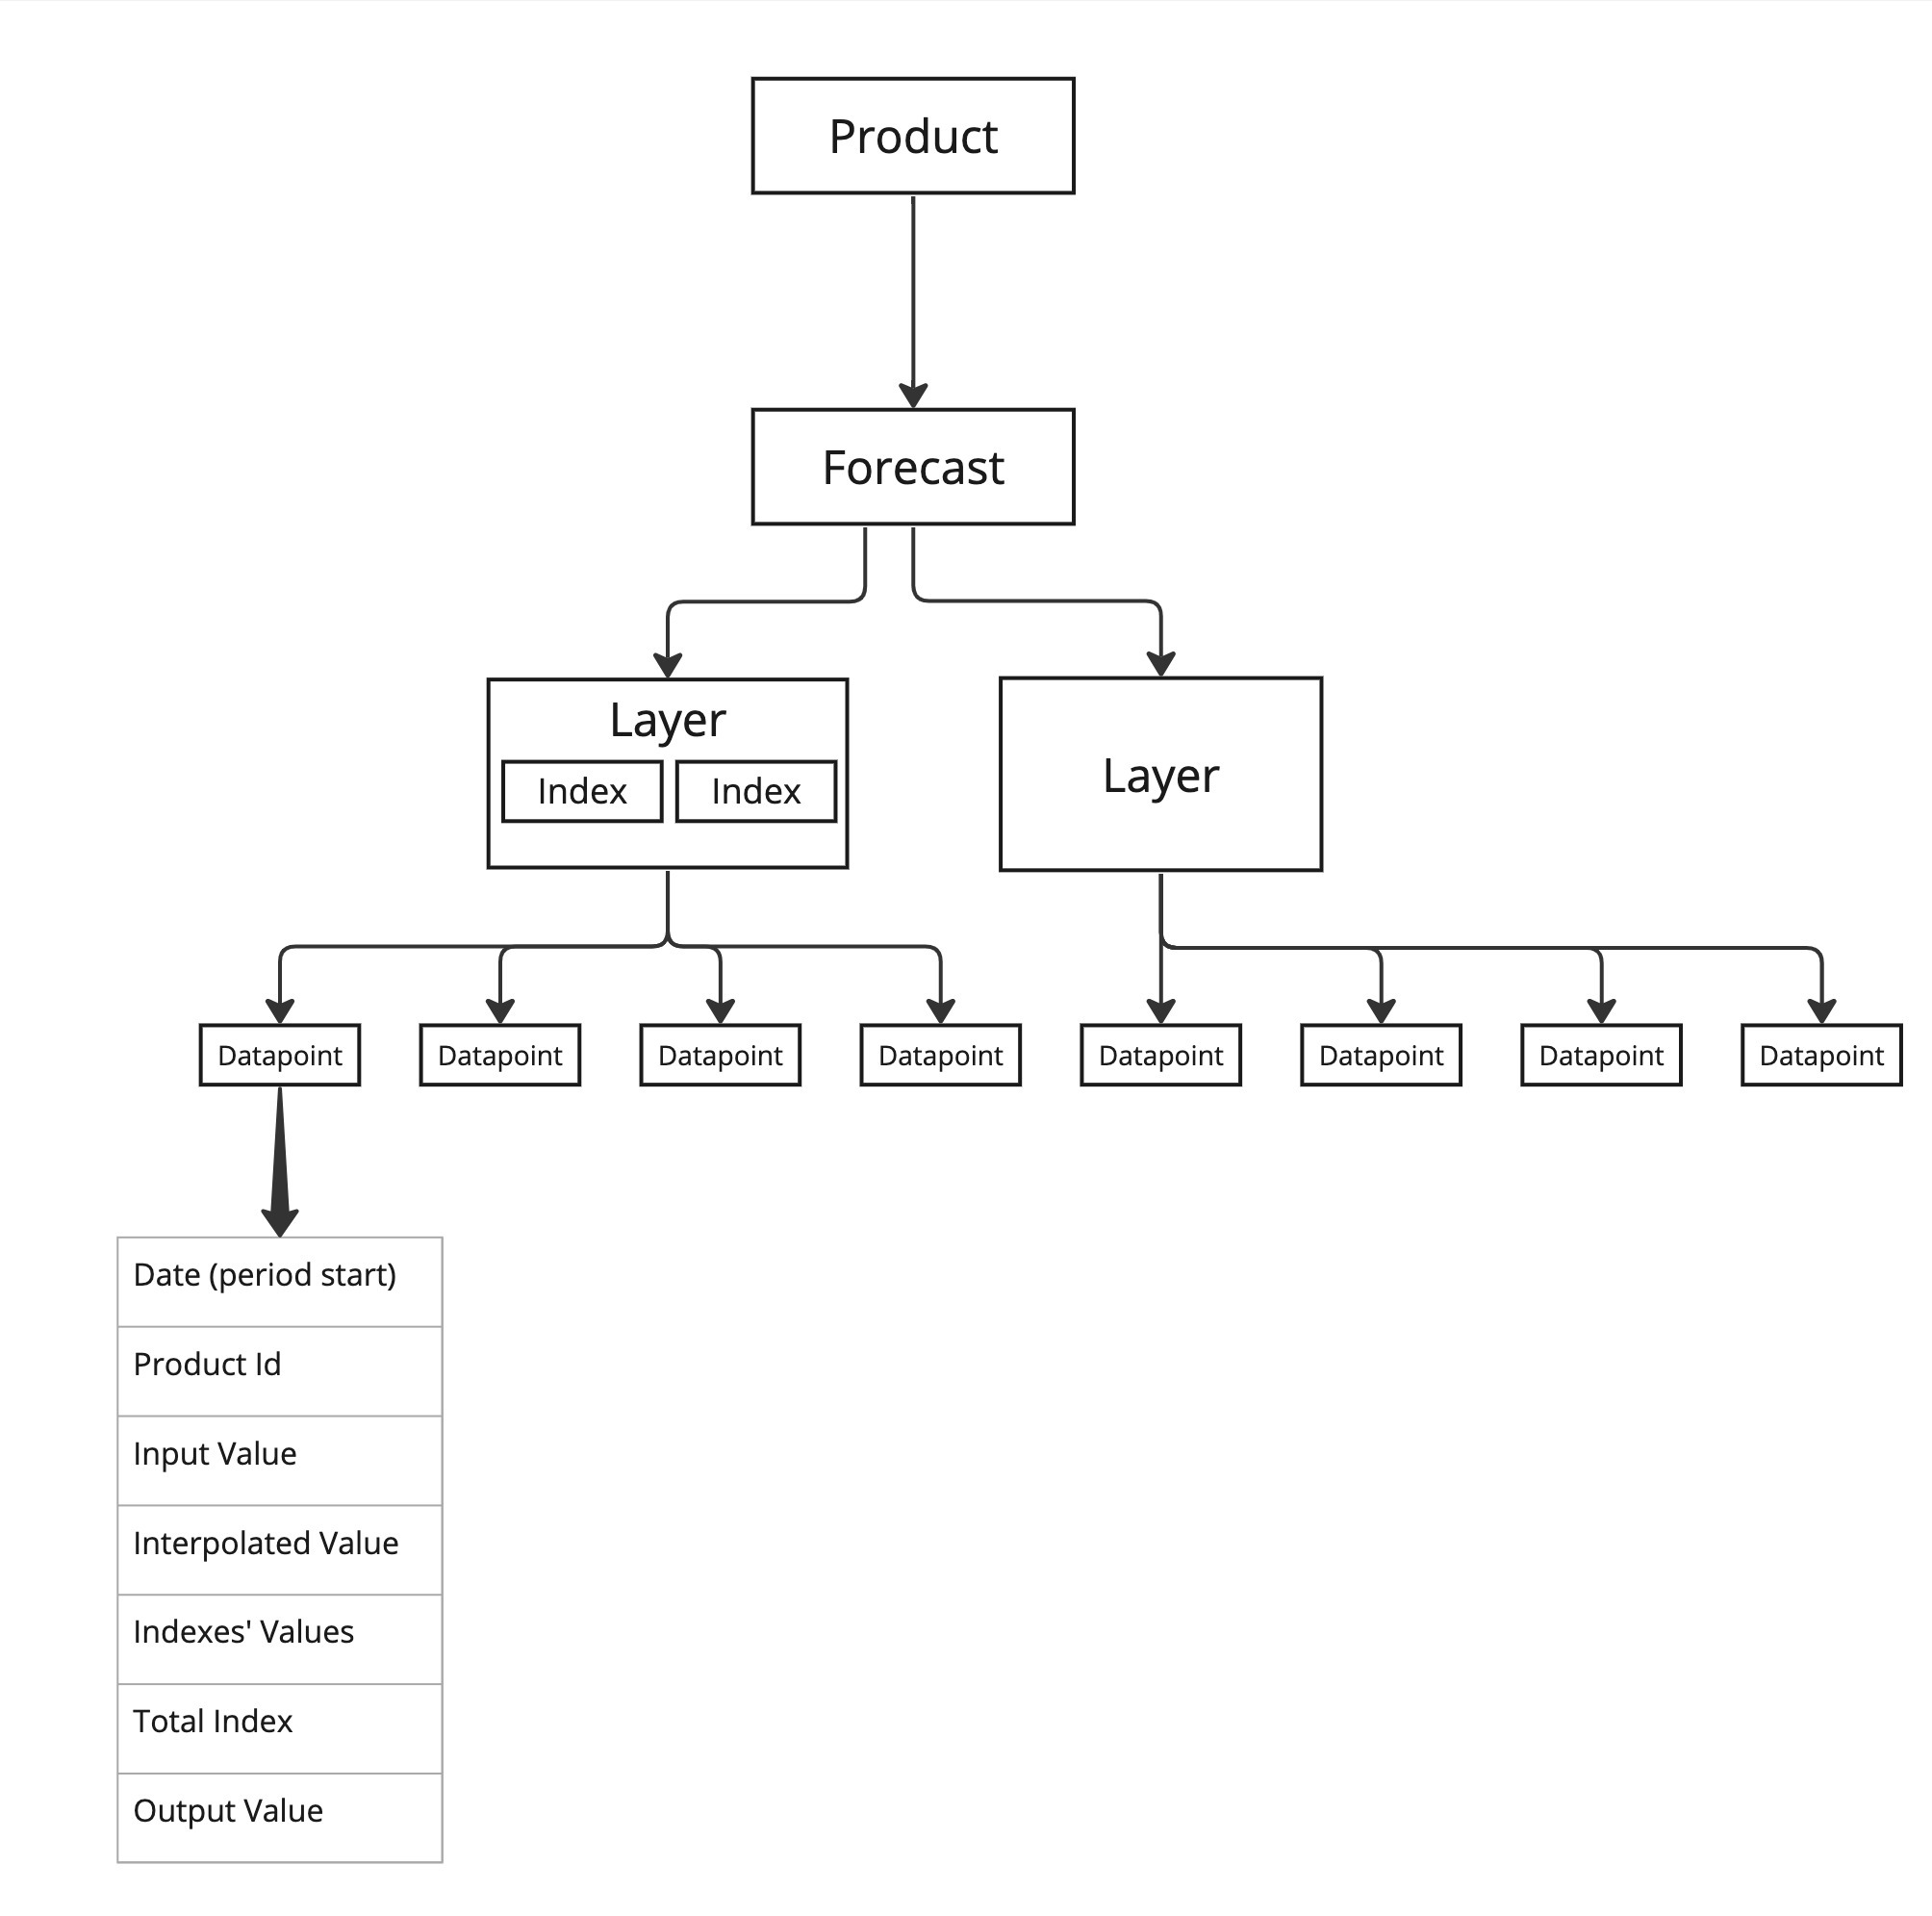
Forecasts
- There are multiple Forecast presets
- Each Product can be linked to a Forecast preset
Layers
Forecast's Datapoints are grouped in Layers
- A Layer represents a source of data, like sales or inventory
- Multiple properties can be set for a Layer, see Automated Demand Forecasting, Inventory Replenishment and Out-of-stock Preventing System#3. Forecast Settings
Indexes
Indexes can be applied to a Layer's datapoints
- there following types of Indexes
- Seasonal Index - average for the cycle. Period length can be set in Forecast Settings→Cycle Duration
- Growth: Cycle - growth rate for the period compared to the same period of the previous cycle
- Growth: Linear - growth rate for the current period compared to the previous period
- Index weights can be set in each Index's settings
- if weight is 0% then index is not applied
- if weight is 100% then index value is applied in full effect. For example, if the index type is Season Index, index weight is 100% and there are no other indexes, then all the values will be equal.
Datapoints
- each datapoint is a combination of Product, Layer and Period. Period can be a day, a week etc, depending on Forecast Setting->Granularity
- Datapoint Output value calculation flow is as follows:
- Input Value: a value received from data source, for example, sales quantity for a specific day
- Interpolated Value: if input value is an outlier, it's replaced with the interpolated value, according to the Layer's interpolation settings
- Total Index: product of all applied weighted indexes, if no indexes are added to the layer, Total Index equals 1
- Output Value: equals Interpolated Value multiplied by Total Index and by Layer's Factor.
- Layer's Factor value can be used to alter the polarity of the values. For example, we can make sales values negative and subtract them from positive inventory values, thus calculating the balance
3. Forecast Settings

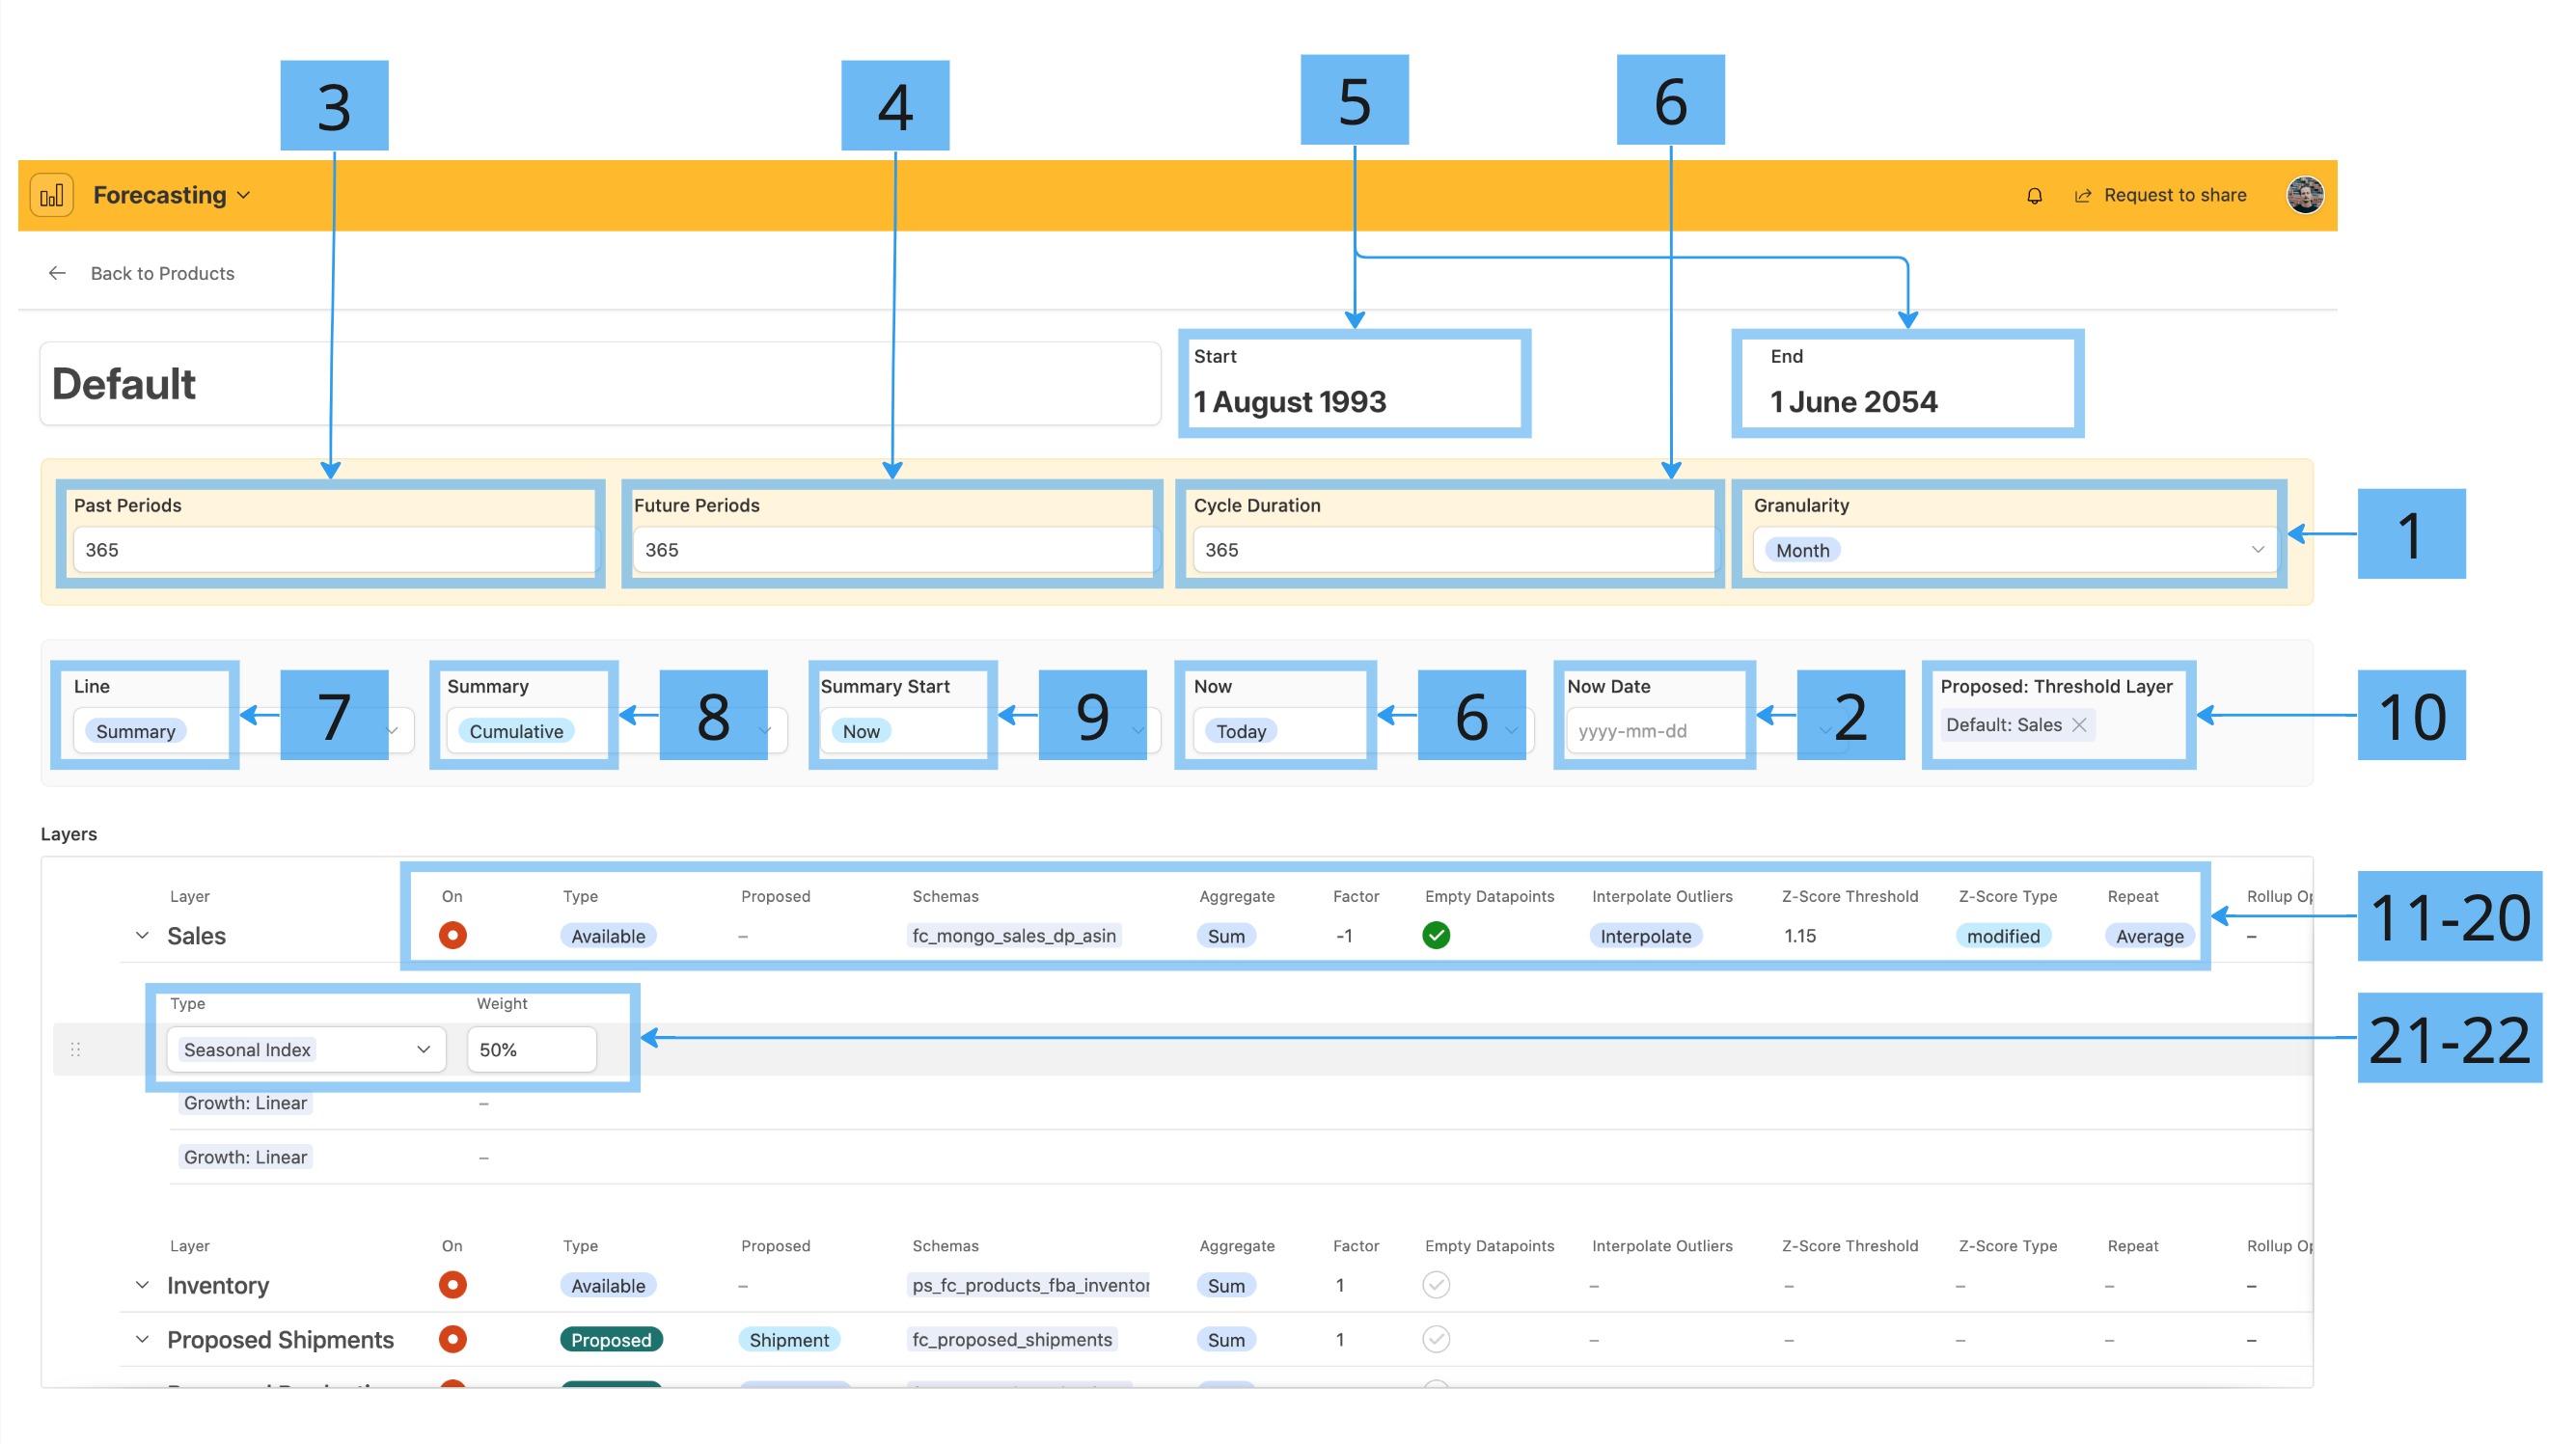
Forecast Settings
- Granularity - forecast's period length. Options: Day/Week/Month/Year
- Now - the forecast's datapoint are divided into past and future. The "now" point of the forecast defines the split between the past and the future. By default Now field is Today, but if Date option is selected, the 'now' point can be specified in Now Date field
- Past Periods - number of periods before the Now date
- Future Periods - number of period after the Now date
- Start and End are auto-calculated basing on the Now and Past/Future Periods settings
- Cycle Duration - length of the forecasting cycle, unit is period (defined by Granularity)
- Line - specifies the mode of the summary line on the detailed forecast chart
- Summary - cumulative or simple sum of the period's datapoints' output values
- Input Value - shows the sum of the datapoints' input values, used for interpolation settings adjustment
- Summary - specifies the Summary mode
- Sum - simple sum of the current period's datapoints' output values
- Cumulative - cumulative of the current and previous periods' datapoints
- Summary Start - specified the starting point of cumulative sum
- Now - starting from the 'now' point
- First Period - starting from the very first period of the forecast
- Proposed: Threshold Layer - proposed shipments/production are created when inventory balance for a period is lower than the product's minimum quantity. Product minimum quantity is calculated basing on the minimum days in stock. Proposed: Threshold Layer points to a layer that is used to calculate the required product minimum quantity for each period, so that this calculated quantity would cover the product demand for the following N days (for example Sales layer)
Layer Settings
- On - enables the Layer's datapoints. If disabled, layer's datapoints are not taken into account when calculating summary
- Type
- Available - goods that are available in stock (for example current Amazon Inventory) and can be used directly in calculation. Also includes historical sales etc.
- Shippable - goods that can become in stock if shipped, for example 3PL Warehouses inventory)
- Proposed - target layer for Proposed Shipments/Production
- Proposed - is Type is Proposed, define if the layers containts the proposed Shipments or Production
- Schemas - 1 or more datasource Schema. Schema is a JSON object processed by the back-end Sync application
- Aggregate - if there's more than 1 schema - aggregation mode of the datasources
- Factor - rate applied to all layer's datapoints' output values
- Layer's Factor value can be used to alter the polarity of the values. For example, we can make sales values negative and subtract them from positive inventory values, thus calculating the balance
- Empty Datapoints - if checked then a datapoint is created for every period, even if there is no data for that period. It's recommended to enable it only on one basic layer, in order to provide a continuous timeline
- Interpolate Outliers - if not empty, datapoints with Z-Score value below Z-Score Threshold are replaced with interpolated values. Following interpolation modes are available:
- Interpolate - outlier values are interpolated using a curve that is built basing on the non-outlying values
- Average - outlier values are replace with the cycle's average value
- Z-Score Threshold - threshold of outlier detection. The lower the threshold, the more datapoint are considered as outliers
- Repeat - if not empty, all the future datapoints' values are replaced with the values from the corresponding period in the previous cycles. For example, this option can be used in combination with indexes to predict sales. The following options are available:
- Average - the repeated value is an average of all the values of all the corresponding past periods. For example, repeated value for a future period January 2025 will be an average of January 2023 and January 2024.
- Last Period - only the last cycle's periods' values will be repeated. For example, repeated value for a future period January 2025 will be the value of January 2024.
Index settings
read more on Indexes Automated Demand Forecasting, Inventory Replenishment and Out-of-stock Preventing System#2. Forecast Structure#Indexes
21. Index Type
22. Weight
To ensure the modified settings are applied and up-to-date proposed items are created, please use Update Forecast button located on the Main Interface to refresh the forecast.
4. Detailed Forecast Chart

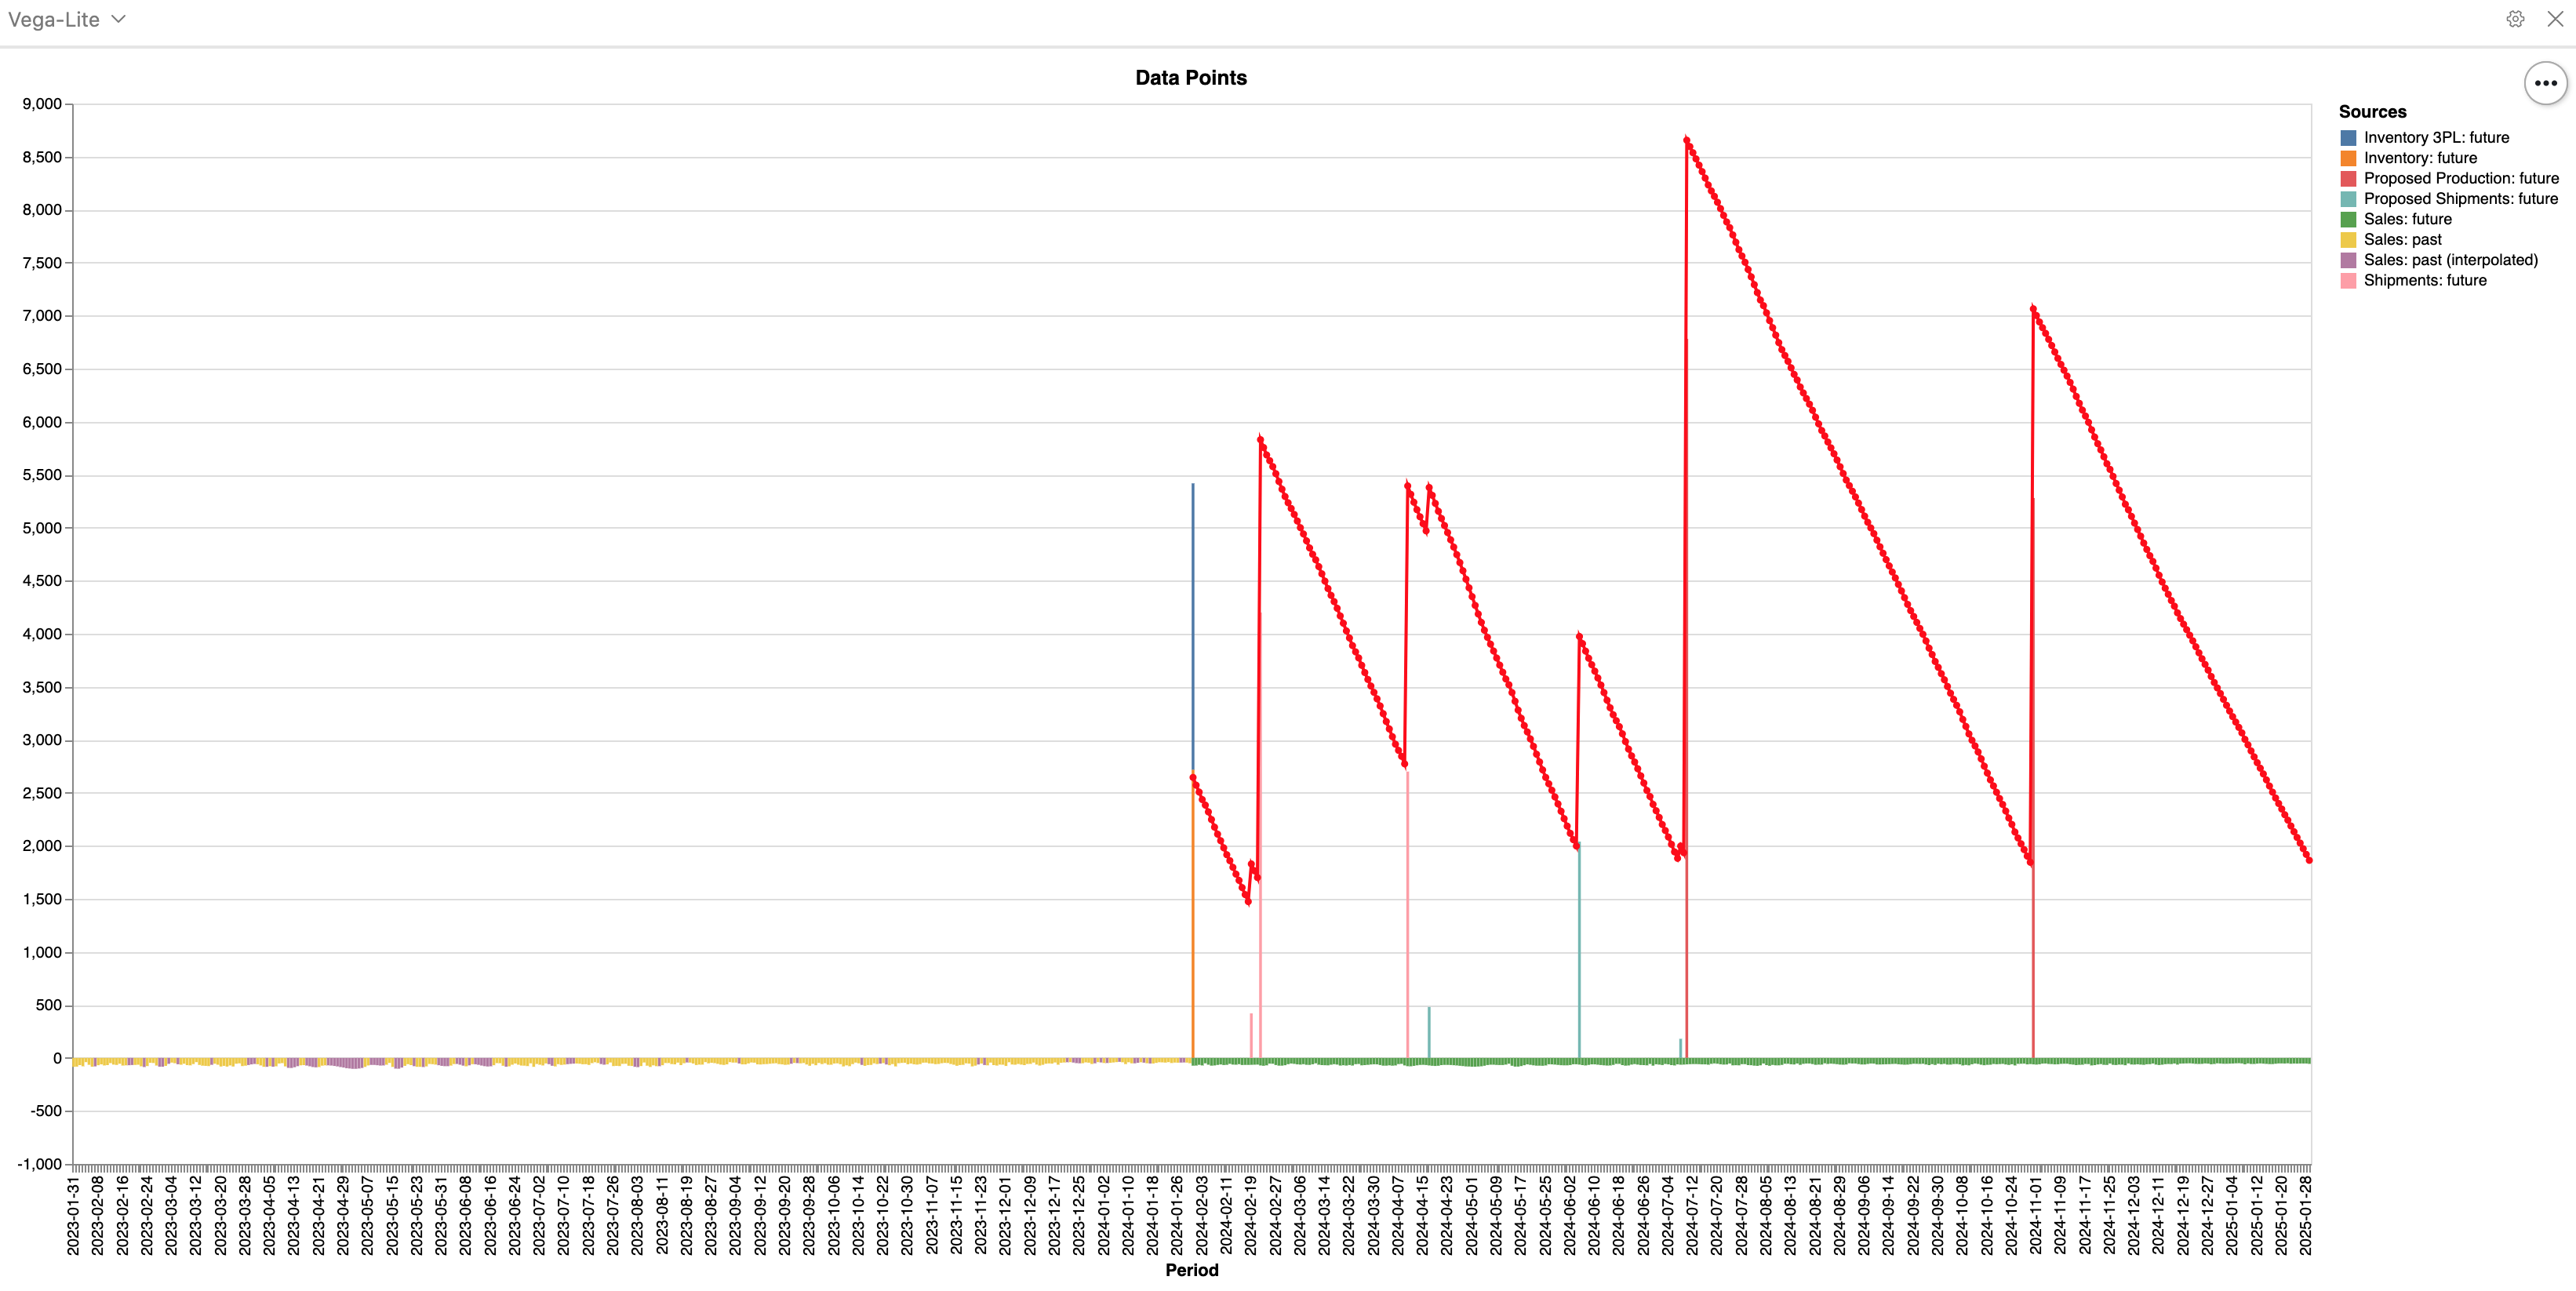
Detailed chart can be used to:
- visualize the datapoints - datapoints are displayed as colored bars, and the legend lists color-coded Layers
- see the inventory balance for each period, starting from now - in the example below the red line indicates the inventory balance.
- see how each layer impacts the summary line - video example
- by enabling/disabling the layers (Layer->On) you can remove its datapoint from the chart and see how the summary line reacts to it. On the example below, turning off the Proposed Layers displays the inventory balances before adding the proposed events, so we can see the OOS points.
- adjust index weights - video example
- Forecasting projects the future datapoints' predicted values with Layer->Repeat enabled. Index values are also calculated. By increasing Indexes' weights we can smooth the repeated values and take growth factor into account.
To ensure the modified settings are applied and up-to-date proposed items are created, please use Update Forecast button located on the Main Interface to refresh the forecast.